Catchment Crawl 2019 featuring Mary from the Air
Catchment Crawl 2019 – watch the video with aerial footage captured during the Catchment Crawl accompanied by Steve Burgess on piano with his original composition “Booloumba”, and see below for a summary of the two day event.
The MRCCC’s annual Catchment Crawl was held over 8-9th October, 2019. This activity is designed to provide a snapshot of water quality along the Mary River and tributaries at the same time each year. The first catchment crawl occurred in 2002 focused only on the Mary River. Water quality parameters are measured to gain insight into trends associated with cumulative effects and any other changes throughout the catchment. As with previous years, the 2019 Catchment Crawl covered the length of the catchment from the headwaters in the Conondale Ranges downstream to the mouth where the Mary River joins the Great Sandy Strait at River Heads.
Physico-chemical water quality parameters including temperature, pH, electrical conductivity (salinity), turbidity and dissolved oxygen were measured at each site. In addition, samples were collected to enable nutrient (phosphorus and nitrogen) and total suspended solids (sediment load) analysis. E. coli (faecal coliforms) were also sampled at most sites.
TEMPERATURE
During the 2019 Catchment Crawl, the upper catchment (headwaters to Gympie) displayed the second highest temperature range in the last 3 years, second to 2017. The lower catchment displayed lower temperatures, with some sites observed to be the coolest of the previous 11 years. Water temperature rising to 21°C is the trigger for Mary River cod spawning. Three Mary River sites sampled in 2019 were observed below 21°C. These included the Mary River headwaters site above Conondale, Widgee Crossing downstream of Gympie, and the Woolooga Bauple Road Bridge in the Munna Creek district. This is the highest number of sites to comply in the previous 11 years, since 2008, which is appropriate for Mary River cod breeding. The 2017 Catchment Crawl remains the hottest of the previous ~decade, and 2016 the coolest.
Continuation of the annual catchment crawl will lead to improved understanding of water temperature long-term trends. This is important not only for the threatened aquatic species including the Mary River cod, but for understanding the impact of riparian restoration work undertaken by the MRCCC and other organisations in the catchment.
ELECTRICAL CONDUCTIVITY
An interesting result in 2019 was a change in the electrical conductivity profile along the river. The upper catchment displayed the highest EC trend seen since 2008, very similar to 2018. Downstream of Gympie, the Mary River displayed a significant decrease in EC from Miva downstream and was observed to be the lowest since 2008. All Mary River sites, except Miva, complied with the EC guideline of <580 µS/cm. This is the best observed compliance rate since 2016.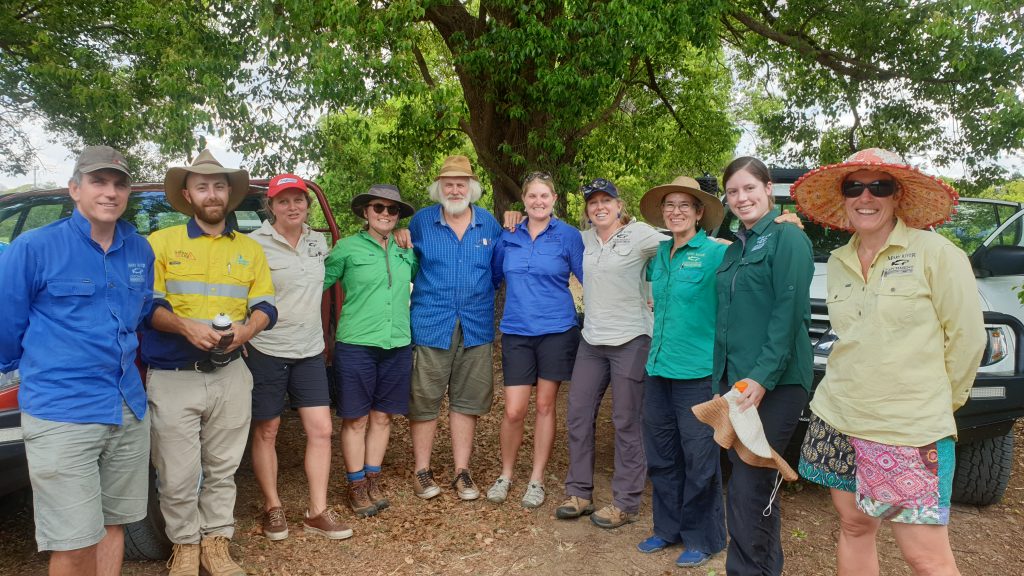
FLOW & AMBIENT TEMPERATURE
Stream flow in the two months prior to the Catchment Crawl was best in 2019 compared to the previous years. However, October 2017 and 2018 saw some early rainfall which meant stream flow in the week of the Catchment Crawl was higher than 2019. The electrical conductivity observed in the upper catchment was comparable to previous years.
The lower catchment displayed the lowest EC levels in the previous ~decade. This is despite having the lowest flow at the time of the Catchment Crawl. It could be attributed to better flow conditions in the previous 2 months, or it could be that there is a lag time for increased EC which we haven’t seen yet due to better winter rainfall in 2019.
In both 2017 and 2018 the river had reached cease to flow conditions in late September prior to the Catchment Crawl occurring in the second week of October. This explains the high electrical conductivity results downstream where the infiltration of saltier base flow into the river becomes more dominant. The cease to flow conditions were more prolonged in 2017, hence the higher electrical conductivity downstream.
It is interesting that these cease to flow conditions did not have as strong an effect on the water temperatures in 2019 and 2018 as they did in 2017. The ambient air temperature in the lead up to the 2019 Catchment Crawl was hotter than 2018 but cooler than 2017. In the week prior to the 2017 Crawl, the average daily maximum air temperature was 28°C and the average daily minimum was 18°C. In 2018 the average daily maximum and minimum for the week prior to the Crawl was cooler at 26°C and 13°C respectively.
In 2019 the average daily maximum was slightly higher than 2017 at 29°C, but the minimum was 4°C lower than 2017 at 14°C. Higher water temperatures observed in 2017 can partly be attributed to the higher average daily minimum temperatures in the lead up to the Catchment Crawl.
- E. COLI
Escherichia coli (E. coli) is a bacterium that is commonly found in the gut of humans and warm-blooded animals. E. coli levels are used as indicators of the presence of faecal material in drinking and recreational waters. Both indicate the possible presence of disease-causing bacteria, viruses, and protozoans. Sources of bacteria include improperly functioning wastewater treatment plants, leaking septic systems, storm water runoff, animal carcasses, and runoff from animal manure and manure storage areas.
The guideline for E.coli level used is the Primary Contact guideline (ANZECC and ARMCANZ, 2000) and the value is 150 MPN/100ml. The most probable number (MPN) is the number of organisms that are most likely to have produced laboratory results in a particular test.
The highest E. coli levels observed on the Mary River during the 2019 Catchment Crawl were at the Gympie Weir (1000 MPN), followed by Kenilworth (770 MPN) (downstream of Obi Obi Creek confluence), then Walli Mountain (650 MPN). Moy Pocket (310 MPN) and Kenilworth (200 MPN) (upstream of Obi Obi Creek confluence) also exceeded the guideline at the time of the Catchment Crawl.
The Gympie Weir sample was taken above the weir at the dome (stormwater drain). The dome was flowing at the time, despite there being little to no rainfall in the lead up. The high reading could indicate that there is E. coli coming from the stormwater inputs. The results on the Mary River at Kenilworth above and below the confluence of Obi Obi Creek suggest that Obi Obi Creek is also a source for E. coli.
Once all of the laboratory results are available a full 2019 Catchment Crawl report will be completed. The report will be available to download from the Waterwatch page on the MRCCC’s website.
The MRCCC acknowledges all the landholders and volunteers who visited us or helped us with the crawl, particularly Ian Mackay, Stan Chandler, Steve Burgess, Garth Jacobson, Bob and Lorraine Hood, and Darren Manderson.
Thanks also to Seqwater for supporting this year’s Catchment Crawl and the Queensland Government Department of Environment and Science for supporting all of the nutrient and total suspended solids analyses.